
An amorphous core transformer typically costs 20-30% more upfront than an equivalent silicon steel unit, and pays that premium back through lower no-load losses — but the payback period ranges from under five years to never, depending almost entirely on how lightly loaded and how continuously energized the transformer actually is. That single variable, not the headline efficiency numbers, is what should drive the decision.
We get some version of this question every time a distribution utility or OEM asks us to quote amorphous cores alongside our standard non-oriented and grain-oriented lines: “how long until this pays for itself?” A utility engineering team we quoted this spring had already penciled in a 3-year payback, borrowed from a vendor’s marketing page — not their own load data.
When we ran their actual SCADA numbers instead, the honest answer came out closer to 14 years, and the project went with premium GOES instead. That’s the gap this article is trying to close: the honest answer needs a real formula, not a vendor efficiency chart — and, as of 2026, a formula that also accounts for what Section 232 tariffs are doing to the baseline cost of imported silicon steel in the first place.
Key Takeaways
- Amorphous transformer cores carry a roughly 20-30% purchase price premium over equivalent grain-oriented silicon steel (GOES) cores, based on published industry buying guides and manufacturer pricing pages.
- DOE-referenced loss data puts amorphous no-load loss reduction at approximately 50% versus standard GOES at a 20% capacity factor, dropping to about 32% at a 30% capacity factor — the gap narrows as load rises.
- In a worked example on a 500 kVA distribution transformer, a lightly loaded (20% capacity factor) unit can repay its amorphous premium in roughly 8 years; the same core at a heavier 30% capacity factor stretches past 15 years — the same steel, two very different answers.
- China’s GB 18613-2020 Grade 1 non-oriented steel already reaches an efficiency tier close to what many amorphous conversions are chasing, without the manufacturing changes amorphous cores require.
- For U.S. buyers paying the 25% Section 232 duty on imported GOES/Hi-B steel, domestic amorphous cores can undercut tariffed silicon steel on upfront price too, not just on TOC — a 2026-specific dynamic, not a stable long-term rule.
What “Total Owning Cost” Actually Means Here
Transformer buyers who only compare purchase price are answering the wrong question. The metric that manufacturers like Metglas use to justify amorphous cores — and that utilities use in procurement specifications — is Total Owning Cost (TOC): TOC = Initial Purchase Price + Cost of Future Energy Losses, with the energy-loss term discounted over the transformer’s service life, typically 20-30 years.
That second term is doing almost all the work in an amorphous-vs-silicon-steel comparison. A transformer’s core (no-load) loss is constant the moment it’s energized, regardless of whether it’s carrying any load — it’s the price of keeping the magnetic field alive in the core material.
Our non-oriented steel line and standard GOES both carry meaningfully higher no-load loss than amorphous alloy, and that loss accumulates every hour the transformer is connected to the grid, not just when it’s serving demand.
This is why TOC, not sticker price, is the right comparison — and why the answer changes so much depending on how a given transformer is actually used, which we work through below.
How Much More Does Amorphous Actually Cost Upfront
Industry buying guides and manufacturer pricing pages consistently put the amorphous premium at 20-30% above an equivalent silicon steel core under normal, untariffed pricing. That premium is driven by two real manufacturing constraints we’ve covered in detail separately.
Amorphous ribbon is far thinner than rolled silicon steel and too brittle to stamp, so cores are wound rather than cut from laminations — a slower, more specialized process with a smaller global supplier base than standard GOES or NOES coil production.
| Cost Driver | Standard Silicon Steel Core | Amorphous Core |
|---|---|---|
| Core material cost | Baseline | Higher per kg |
| Manufacturing process | Stamp/stack laminations | Wind or laser-cut ribbon |
| Global supplier base | Wide (China, Japan, Korea, EU mills) | Narrow (Metglas US, a handful of Chinese and Indian producers) |
| Typical purchase premium | — | ~20-30% |
| Core cross-section for same rating | Baseline | ~25-30% larger (lower saturation flux density) |
That last row matters for anyone comparing quotes on paper: because amorphous alloy saturates around 1.56 Tesla versus 1.8-2.0 Tesla for standard CRGO, an amorphous core needs roughly a quarter to a third more cross-sectional steel to handle the same power rating — part of the premium is simply more material, not just a higher per-kilogram price.
The Loss Side: What DOE-Referenced Data Actually Shows
The clearest published loss data we’ve found comes from Metglas’s technical materials, which cite the 2016 U.S. Department of Energy distribution transformer efficiency standard as the baseline for comparison:
| Capacity Factor | Loss Reduction vs. GOES | Annual Savings (Single-Phase, per MVA) | Annual Savings (Three-Phase, per MVA) |
|---|---|---|---|
| 20% | ~50% lower losses | 11,258 kWh | 6,935 kWh |
| 30% | ~32% lower losses | 8,606 kWh | 5,282 kWh |
At the efficiency level, a 400 kVA transformer at 20% load reaches roughly 99.81% efficiency with an amorphous core versus 99.69% for a GOES core under the EU Tier 1 benchmark — a gap that sounds trivial until it’s translated into the loss-reduction and kWh figures above, which is the point of running the TOC calculation instead of comparing efficiency percentages directly.
Notice the pattern across both rows: the reduction percentage is larger at 20% capacity factor than at 30%. That’s not noise in the data — it’s the physics of core loss, which is constant regardless of load, versus copper (load) loss, which scales with the square of current. At light loads, core loss makes up a larger share of total loss, so cutting core loss delivers a bigger relative improvement. That single fact is why the payback math below depends so heavily on duty cycle.
A Worked Payback Example (With the Assumptions Shown)
Here is a worked example for a 500 kVA distribution transformer, using the Metglas/DOE loss data above and stated, clearly-labeled assumptions for the two inputs that data doesn’t provide: purchase price and electricity rate. Change either input and the payback year changes with it — that’s the point of showing the math rather than quoting a single number as universal.
Assumptions used (illustrative, not site-specific):
- Base silicon steel core price: ~$18,000 (a representative mid-range figure for a 500 kVA distribution unit; actual quotes vary by region and specification)
- Amorphous premium: 25% (midpoint of the 20-30% range cited above) = ~$4,500 additional
- Industrial electricity rate: $0.10/kWh (a common U.S. industrial average; rates vary significantly by region and utility)
| Scenario | Annual Loss Savings | Annual $ Savings | Simple Payback |
|---|---|---|---|
| 500 kVA (0.5 MVA), 20% capacity factor, single-phase | 5,629 kWh | ~$563 | ~8 years |
| 500 kVA (0.5 MVA), 30% capacity factor, single-phase | 4,303 kWh | ~$430 | ~10.5 years |
| 500 kVA (0.5 MVA), 30% capacity factor, three-phase | 2,641 kWh | ~$264 | ~17 years |
We’re showing the three-phase 30% scenario deliberately, because it’s the one every glossy amorphous sell sheet leaves out: on a more heavily loaded three-phase unit, the payback stretches well past a decade — long enough that plenty of buyers will reasonably decide it isn’t worth the premium, especially if the transformer isn’t expected to stay in service that long or if capital costs carry a real discount rate.
Where this example doesn’t apply: these numbers assume a distribution-class transformer running continuously. For intermittently loaded units, or larger power transformers where copper loss dominates total loss at typical operating points, the core-loss advantage of amorphous alloy contributes far less to TOC, and the payback case gets substantially weaker — sometimes to the point of not making sense at all.
Why Duty Cycle Changes the Answer More Than Anything Else
The pattern in the table above generalizes into a simple rule: amorphous cores make the strongest economic case in transformers that are energized 24/7 but lightly loaded most of the time — classic residential and light-commercial distribution transformers, sitting on a pole or pad, carrying a fraction of their rated capacity for most hours of the year.
That’s also exactly the segment the current U.S. policy debate is focused on. The Department of Energy’s amorphous-core distribution transformer mandate — now under a June 2026 comment period reconsidering the rule — targets this same low-load, always-on category, not power transformers or industrial units running closer to rated capacity.
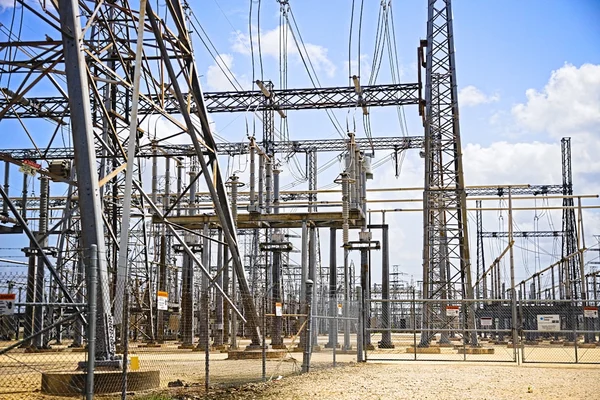
Power transformers and heavily loaded industrial units sit at the other end: copper loss, which scales with load squared, dominates total loss, and core-loss reduction contributes proportionally less to the TOC calculation. For those applications, a premium GOES grade — Hi-B CRGO, for instance — often delivers more TOC improvement per dollar than switching core material entirely.
A second lightly-loaded-but-continuous case worth flagging: solar inverter step-up transformers and EV charging infrastructure transformers often share the same duty-cycle profile as residential distribution — energized around the clock, but carrying a fraction of rated capacity during low-generation or low-charging-demand hours.
Buyers specifying transformers for these applications should run the same capacity-factor math above rather than assuming amorphous only makes sense for classic pole-mounted distribution units; the physics that favors amorphous cares about duty cycle, not the label on the application.
2026 Section 232 Tariffs Are Changing the Baseline Cost Comparison
Every payback figure above assumes the 20-30% amorphous premium is calculated against untariffed silicon steel pricing. That assumption doesn’t hold for every buyer in 2026, and this is the part of the comparison that’s genuinely new this year rather than a stable physics fact like core loss.
U.S. Section 232 tariffs currently apply a 25% duty to imported steel derivative products, explicitly including Hi-B and standard grain-oriented electrical steel grades. Metglas — the only U.S.-based amorphous alloy producer — has started marketing directly to buyers looking for a domestic alternative specifically to avoid that 25% duty, positioning its amorphous distribution transformer designs as a lower-cost option than tariffed GOES and Hi-B grades, not merely a TOC-competitive one.
That’s a meaningfully different claim than the 20-30%-premium framing used earlier in this article, and it only applies to a specific buyer profile: a U.S.-based purchaser sourcing GOES or Hi-B steel from overseas mills and paying the Section 232 duty on it. For that buyer, the real comparison isn’t “20-30% premium vs. a payback period” — it’s “tariffed import price vs. domestic amorphous price,” which can flip the upfront-cost advantage entirely.
| Buyer Profile | Relevant Cost Comparison | Likely Outcome |
|---|---|---|
| U.S. buyer importing GOES/Hi-B, paying 25% Section 232 duty | Tariffed import price vs. domestic amorphous price | Amorphous premium narrows or disappears upfront, on top of TOC savings |
| U.S. buyer sourcing domestically-produced GOES | Standard 20-30% premium framework (as above) | Standard payback math applies |
| Non-U.S. buyer (no Section 232 exposure) | Standard 20-30% premium framework (as above) | Standard payback math applies |
This is also unfolding against a broader 2026 supply crunch: industry lead-time tracking has cited distribution and power transformer lead times stretching well past a year, with U.S. transformer demand up roughly 119% since 2019 on some industry estimates. In that environment, some buyers are choosing whichever core material a supplier can actually deliver on schedule, not strictly whichever wins the TOC calculation — worth factoring in alongside the payback math above, not instead of it.
Sourcing Amorphous Cores from China: GB 18613, MOQ, and Lead Time Reality
For buyers sourcing from Chinese mills specifically, two practical realities shape the amorphous-vs-silicon-steel decision beyond the TOC math:
- China’s own efficiency standard already offers a middle path. GB 18613-2020 has included a Grade 1 non-oriented tier — roughly equivalent to IE5-class efficiency — as a voluntary category since 2020. For buyers who need a meaningful efficiency step up without switching to a wound-core manufacturing process, a Grade 1 ultra-thin gauge NOES core is a real option worth quoting alongside amorphous, not just against standard GOES.
- The amorphous supplier base is genuinely narrower. Standard GOES and NOES coils ship from dozens of qualified Chinese mills with established export documentation and MOQ structures. Amorphous ribbon and finished cores come from a much smaller set of producers, which in our experience translates to longer lead times and less MOQ flexibility than a buyer used to sourcing standard silicon steel coils will expect — worth confirming with any supplier before assuming amorphous lead times will match standard coil lead times.
Neither point argues against amorphous cores where the TOC case is genuinely strong. Both are reasons to get real quotes — price, MOQ, and lead time — for both material paths before the payback math becomes the only variable in the decision.
Amorphous vs. Premium Silicon Steel: A Decision Framework
| Your Situation | Amorphous Core Likely Wins | Premium Silicon Steel Likely Wins |
|---|---|---|
| Duty cycle | Continuous, lightly loaded (residential/light-commercial distribution) | Intermittent or heavily loaded (industrial, power transformers) |
| Service life expectation | Long (20-30 years, payback has time to complete) | Shorter, or capital budget favors lower upfront cost |
| Regulatory driver | Operating in a market moving toward mandated amorphous cores | No near-term mandate exposure |
| Supply chain tolerance | Can accommodate longer lead times, narrower supplier base | Needs standard MOQ/lead-time flexibility |
| Efficiency need | Needs the largest available no-load loss cut | Grade 1 GB 18613 NOES or Hi-B GOES already closes most of the gap |
To put the “premium GOES wins” side of that table into the same terms as the worked example above: a power transformer running at, say, a 60-70% capacity factor sees a far smaller percentage loss reduction from amorphous alloy than the 20-30% range shown earlier, because copper loss — unaffected by core material — makes up most of its total loss at that utilization.
Run the same simple-payback formula at that capacity factor and the amorphous premium frequently doesn’t recover within the transformer’s service life at all, which is why amorphous adoption has concentrated almost entirely in the distribution-transformer segment rather than power transformers.
Before You Send an RFQ for Amorphous Cores
- Ask for TOC-basis quotes, not just unit price — request the loss figures at your actual expected capacity factor, not a generic 20% or 30% reference point.
- Confirm lead time and MOQ for amorphous cores specifically; don’t assume they match your standard GOES or NOES coil terms.
- Get a Grade 1 GB 18613 NOES quote alongside the amorphous quote if your application can tolerate a smaller (not larger) efficiency step — it may close most of the gap at a fraction of the premium.
- Verify which capacity factor and electricity rate the supplier used in any payback figure they hand you — as the worked example above shows, both inputs swing the answer by years. We’ve had to send more than one quote back after realizing the buyer’s assumed capacity factor was off by nearly double.
FAQ
Are amorphous transformers actually more expensive?
Yes. Published buying guides and manufacturer pricing consistently show a 20-30% higher upfront purchase price for amorphous cores versus equivalent silicon steel cores, driven by the more specialized winding manufacturing process and larger core cross-section amorphous alloy’s lower saturation flux density requires.
How long does it take an amorphous transformer to pay for itself?
It depends almost entirely on duty cycle. In the worked example above, a lightly loaded (20% capacity factor), continuously energized 500 kVA distribution transformer pays back its premium in roughly 8 years; the same unit at a heavier 30% three-phase load can take 17 years or more — sometimes longer than the premium is worth for a given buyer’s capital planning horizon.
Is amorphous steel always more efficient than silicon steel?
Amorphous alloy has consistently lower no-load (core) loss than any grade of silicon steel, but “more efficient overall” depends on load. Because copper loss scales with load and amorphous doesn’t materially change copper loss, a heavily loaded transformer’s total efficiency advantage from an amorphous core is smaller than the no-load loss numbers alone suggest.
Can non-oriented silicon steel get close to amorphous efficiency without switching materials?
In some cases, yes. China’s GB 18613-2020 Grade 1 non-oriented tier — a voluntary category roughly equivalent to IE5-class efficiency — closes much of the gap for buyers who don’t need the full no-load loss reduction amorphous alloy offers, without the manufacturing and supply chain changes a wound amorphous core requires.
Does amorphous core switching make sense for power transformers?
Rarely, in our experience. Power transformers typically run at higher capacity factors than distribution transformers, where copper (load) loss — which amorphous alloy doesn’t reduce — makes up most of total loss. The payback math that favors amorphous at 20-30% capacity factor usually stops making sense well before a transformer’s typical power-transformer utilization level.
What capacity factor should I use to run my own payback calculation?
Use your transformer’s actual average loading over a representative period, not its nameplate rating. A capacity factor is average load divided by rated capacity, typically measured over a year; utility load studies or SCADA logs for an existing installation are the most reliable source, and a supplier’s TOC quote should ask for this figure rather than assume a generic 20% or 30% reference point.
Do Section 232 tariffs change whether amorphous cores are worth it?
For U.S. buyers importing GOES or Hi-B steel and paying the 25% Section 232 duty, yes — it can shift the comparison from “20-30% premium with a payback period” to a smaller or even negative upfront premium against tariffed silicon steel pricing. Buyers sourcing domestically-produced GOES, or sourcing from China outside that tariff exposure, should still use the standard 20-30% premium framework in this article.
Bottom Line
The 20-30% price premium on amorphous transformer cores is real, and so are the loss savings — but neither number means anything on its own. Run the TOC math against your actual expected capacity factor before deciding, because the same core that pays back in under a decade on a lightly loaded distribution transformer can take twice as long, or never pay back at all, on a heavily loaded unit.
For U.S. buyers currently paying Section 232 duties on imported GOES or Hi-B steel, also check the tariffed-price comparison in the section above — it can change the answer before TOC even enters the picture. For buyers sourcing from China outside that tariff exposure, get a Grade 1 GB 18613 non-oriented steel quote alongside the amorphous quote — it’s often the option that gets left out of the comparison entirely.
References
- U.S. Federal Register — Energy Conservation Standards for Distribution Transformers, Request for Information (2026-06-15)
- Metglas, Inc. — Distribution Transformer Electrical Steel: Total Owning Cost Methodology
- Metglas, Inc. — Domestic Alternative to 25% Section 232 Import Tariffs on Hi-B Steel
- U.S. Department of Energy — Implementing Guidance for Distribution Transformers (September 2023)


